Diving into observability - Partie 2
(The first part is available here)
Context
Following a discussion with another tech, where I mentioned connection errors to a production DB even though there weren’t many concurrent users, he asked me what instrumentation tool I was using.
The answer was: nothing really specific. Apart from Sentry, which I use to track application error logs for the apps I develop (in .NET).
Operations
8. Integrating metrics from a .NET 8 Web App
Grafana Cloud was no longer working because I was connected through a VPN; and it seems that this causes issues when displaying some tabs of the application.
So I tried to add a new connection via the screen “Add a new connection”: 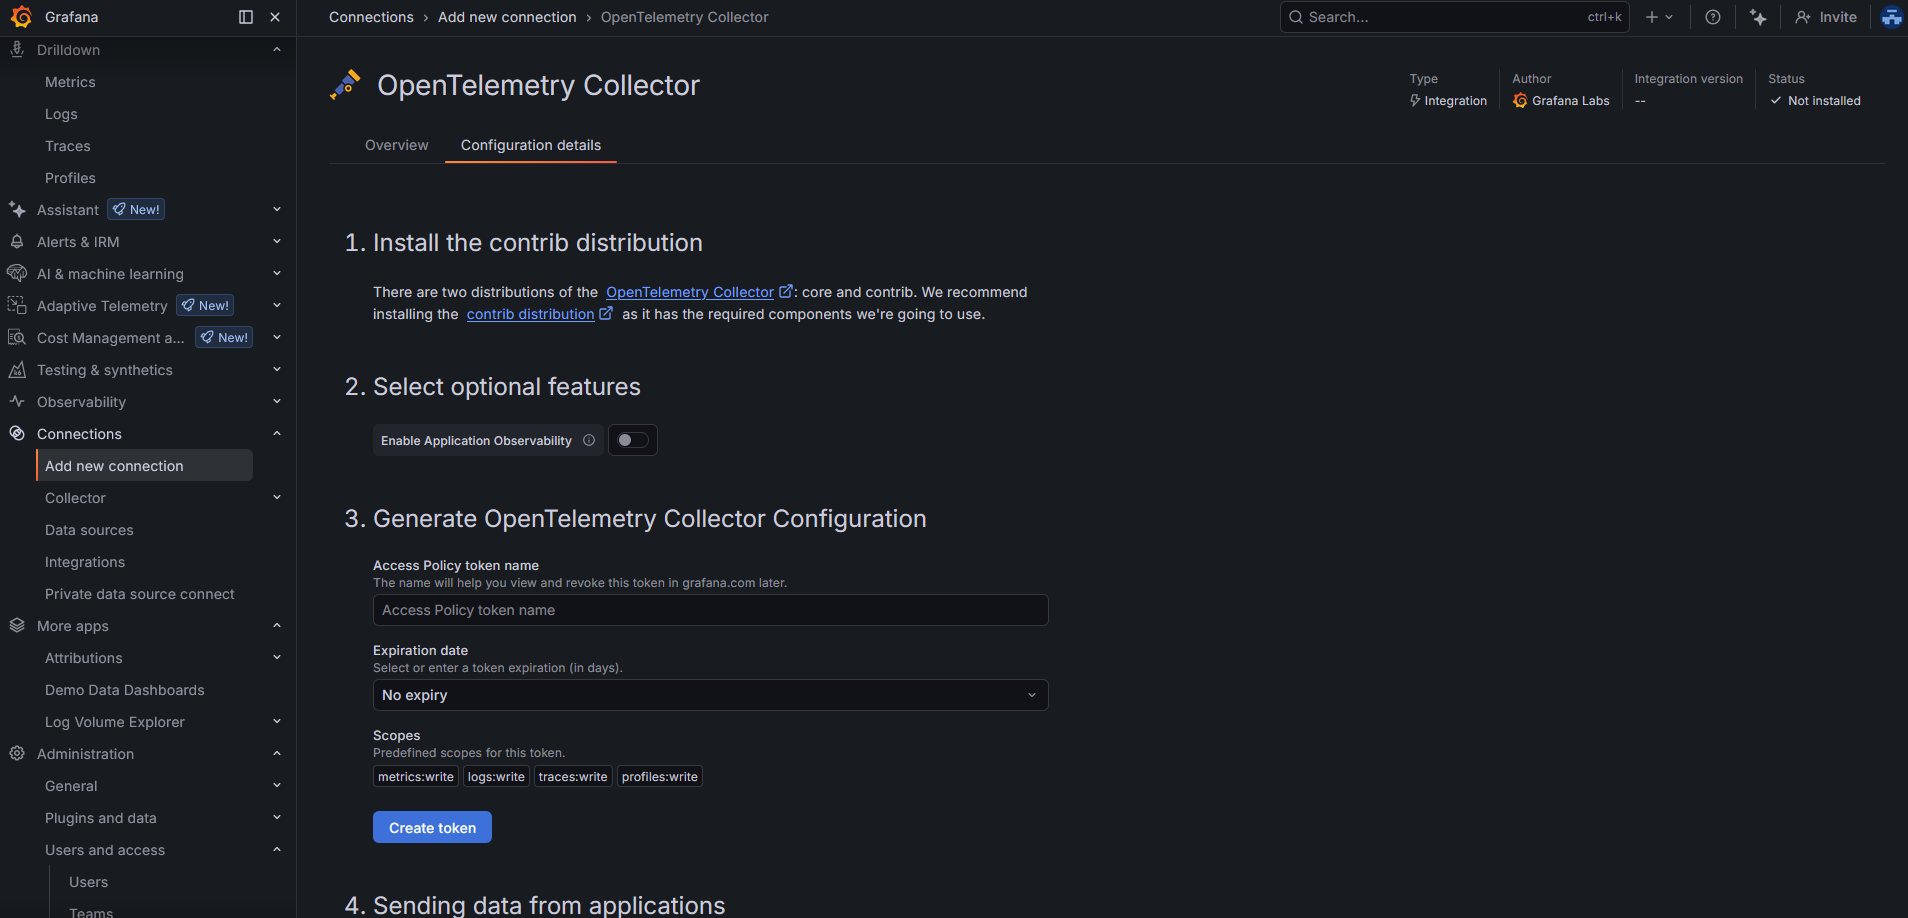 .
.
But this was absolutely not relevant: this screen is mostly a helper to configure a collector dedicated to a specific app. In my case, I set up an OpenTelemetry Collector instance that both pushes and pulls data from my WebApp and my ConsoleApp, and then forwards everything to Grafana Cloud. So this is more of a “generic” collector instance.
By the way, while taking a look at the “Drilldowns → Metrics” tab of my Grafana Cloud instance, I discovered that there actually were metrics coming in from my first configuration on 02/01 😁. 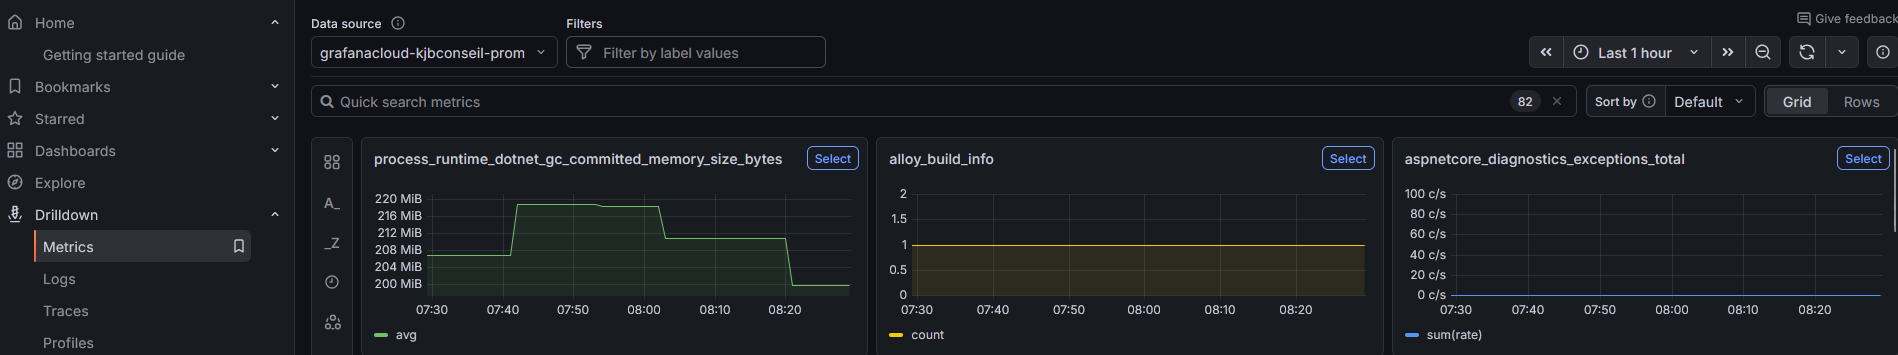 .
.
What did I configure in my web app code?
1
2
3
4
5
6
7
8
9
10
11
12
13
14
15
16
17
18
19
20
21
22
23
24
services.AddOpenTelemetry()
    .ConfigureResource(r => r.AddService(
        serviceName: "clientwebapp",
        serviceVersion: Assembly.GetEntryAssembly()?
                        .GetCustomAttribute<AssemblyInformationalVersionAttribute>()?
                        .InformationalVersion
                        ?? "unknown"))
    .WithMetrics(metrics =>
    {
        metrics
        // ASP.NET Core request metrics (duration, active requests, etc.)
        .AddAspNetCoreInstrumentation()
        // outgoing HTTP calls (HttpClient)
        .AddHttpClientInstrumentation()
        // runtime metrics (GC, CPU time, threadpool, etc.)
        .AddRuntimeInstrumentation()
        // exposes a Prometheus scrape endpoint
        .AddPrometheusExporter();
    });

// other non-related stuff

// IApplicationBuilder app
app.UseRequestLocalization(app.ApplicationServices.GetService<IOptions<RequestLocalizationOptions>>().Value);
I also needed the following dependencies:
1
2
3
4
5
<PackageReference Include="OpenTelemetry.Exporter.Prometheus.AspNetCore" />
<PackageReference Include="OpenTelemetry.Extensions.Hosting" />
<PackageReference Include="OpenTelemetry.Instrumentation.AspNetCore" />
<PackageReference Include="OpenTelemetry.Instrumentation.Http" />
<PackageReference Include="OpenTelemetry.Instrumentation.Runtime" />
9. Integrating metrics from a .NET 8 Console App
Let’s start by configuring the application so that it can properly send metrics:
1
2
3
4
5
6
7
8
9
10
11
12
13
14
15
16
builder.Services.AddOpenTelemetry()
    .ConfigureResource(r =>
        r.AddService(
            serviceName: "jobs",
            serviceVersion: Assembly.GetEntryAssembly()?
                            .GetCustomAttribute<AssemblyInformationalVersionAttribute>()?
                            .InformationalVersion
                            ?? "unknown"))
    .WithMetrics(m =>
    {
        // outgoing HTTP calls (HttpClient)
        m.AddHttpClientInstrumentation();

        // OTLP exporter → Collector
        m.AddOtlpExporter();
    });
I only configure “hard-coded” values for the service name and version. Then, to configure the OTLP endpoint to contact, I rely on environment variables directly on my node, like this:
1
OTEL_EXPORTER_OTLP_ENDPOINT=http://mon_ip_interne:4317
I also ran a quick check to make sure I could reach this IP and port from my application (they are hosted on two different nodes):
1
nc -vz mon_ip_interne 4317
10. Integrating traces on both .NET applications
On the web application, I added a library to manage traces, with the following configuration:
1
2
<PackageReference Include="OpenTelemetry.Exporter.OpenTelemetryProtocol" />
<PackageReference Include="OpenTelemetry.Instrumentation.Hangfire" />
1
2
3
4
5
6
7
8
9
10
services.AddOpenTelemetry()
    //...
    .WithTracing(tracing =>
    {
        tracing
        .AddAspNetCoreInstrumentation()
        .AddHttpClientInstrumentation(o => { o.RecordException = true; })
        .AddHangfireInstrumentation()
        .AddOtlpExporter();
    })
I also took the opportunity to collect information from Hangfire.
Same thing for the console application, since I’m using it there as well:
1
2
<PackageReference Include="OpenTelemetry.Exporter.OpenTelemetryProtocol" />
<PackageReference Include="OpenTelemetry.Instrumentation.Hangfire" />
1
2
3
4
5
6
7
8
9
builder.Services.AddOpenTelemetry()
    //...
    .WithTracing(tracing =>
    {
        tracing
        .AddHttpClientInstrumentation(o => { o.RecordException = true; })
        .AddHangfireInstrumentation()
        .AddOtlpExporter();
    })
11. Integrating metrics and traces on Nginx
I have an Nginx server acting as a proxy in front of my web app.
I’d also like to collect metrics and traces there, in order to introduce a correlation between the incoming request and the data coming out of my web app.
I’m using the Nginx application that is provided directly as an environment type on JElastic, and I don’t have admin rights to do whatever I want with it. So unfortunately, I can’t add the following line to nginx.conf:
1
load_module modules/ngx_http_opentelemetry_module.so;
This module would natively allow collecting specific metrics.
In the medium term, I plan to stop using this managed application and switch directly to a Docker container (maybe based on this one, or not).
In the meantime, I have no other choice but to go through Nginx logs.
So, once I added the following configuration in nginx.conf:
1
2
3
proxy_set_header traceparent $http_traceparent;
proxy_set_header tracestate  $http_tracestate;
proxy_set_header baggage     $http_baggage;
I also had to modify the log format in order to include the previously configured values. In my case, here are the parts that matter:
1
2
3
log_format  main  #other stuff
                    'traceparent="$http_traceparent" tracestate="$http_tracestate" '
                    'upstream_trace_id="$upstream_http_x_trace_id"';
upstream_trace_id allows Nginx to retrieve the ID created by the .NET application and identify that this is a single trace end-to-end.
I wrote a small middleware that sets this trace ID, which I added just after exposing the metrics endpoint:
1
2
3
4
5
6
7
8
9
10
11
12
13
14
15
16
17
18
19
20
21
22
23
24
25
26
27
28
29
30
internal sealed class AddTraceIdToResponseHeaders
{
    private const string _traceHeaderName = "X-Trace-Id";
    private readonly RequestDelegate _next;

    public AddTraceIdToResponseHeaders(RequestDelegate next) => _next = next;

    public Task InvokeAsync(HttpContext context)
    {
        var traceId = Activity.Current?.TraceId.ToString();
        context.Response.OnStarting(() =>
        {
            if (!string.IsNullOrEmpty(traceId) && !context.Response.Headers.ContainsKey(_traceHeaderName))
            {
                context.Response.Headers[_traceHeaderName] = traceId;
            }
            return Task.CompletedTask;
        });

        return _next(context);
    }
}

internal static class AddTraceIdToResponseHeadersExtensions
{
    public static IApplicationBuilder UseAddTraceIdToResponseHeaders(this IApplicationBuilder builder)
    {
        return builder.UseMiddleware<AddTraceIdToResponseHeaders>();
    }
}
By default, the client might not provide a traceparent, and without the ngx_http_opentelemetry_module.so module, no ID is generated.
I placed the call to UseAddTraceIdToResponseHeaders just after UseRouting().
On the collector side, I lost a bit of time because I realized that I had not mounted my Nginx log file correctly.
Indeed, I run a collector container on a node of type Docker Engine. I did mount the directory containing the logs on the node itself.
But I had completely forgotten that I also needed to mount it inside the container — since my node is not directly the collector instance.
So I created a docker-compose file and added a volume mount for the directory shared on the node.
And it works!
I can now follow an HTTP request entering my proxy and then flowing through my web app.
Final configuration of my OpenTelemetry Collector container
1
2
3
4
5
6
7
8
9
10
11
12
13
14
15
16
17
18
19
20
21
22
23
24
25
26
27
28
29
30
31
32
33
34
35
36
37
38
39
40
41
42
43
44
45
46
47
48
49
50
51
52
53
54
55
56
57
58
59
60
61
62
63
64
65
66
67
68
69
70
71
72
73
74
75
76
77
78
79
80
81
82
83
84
85
86
extensions:
  basicauth/grafana_cloud:
    client_auth:
      username: ".."
      password: "..."

receivers:
  otlp:
    protocols:
      grpc:
        endpoint: 0.0.0.0:4317
      http:
        endpoint: 0.0.0.0:4318

  filelog/nginx:
    include:
      - /data/external-logs/proxy/localhost.access.log
    start_at: end
    operators:
      # Parse traceparent + upstream_trace_id out of the line (simple + robust)
      - type: regex_parser
        regex: 'traceparent="(?P<traceparent>[^"]*)"'
      - type: regex_parser
        regex: 'upstream_trace_id="(?P<upstream_trace_id>[^"]*)"'
      # If upstream_trace_id exists, use it as trace_id
      - type: move
        if: 'attributes.upstream_trace_id != ""'
        from: attributes.upstream_trace_id
        to: attributes.trace_id
      # Else extract trace_id from traceparent (00-<traceid>-<spanid>-..)
      - type: regex_parser
        if: 'attributes.trace_id == "" and attributes.traceparent != ""'
        regex: '^00-(?P<trace_id>[a-f0-9]{32})-'
        parse_from: attributes.traceparent
      # Clean up
      - type: remove
        field: attributes.traceparent

  prometheus:
    config:
      scrape_configs:
        - job_name: "clientwebapp"
          metrics_path: /metrics
          scrape_interval: 20s
          static_configs:
            - targets: ["yourlocalipOrDNSAlias:80"]  # ip of the node of the clientwebapp instance

processors:
  # Best practice: first in pipeline to apply backpressure early
  memory_limiter:
    check_interval: 5s
    limit_mib: 512
    spike_limit_mib: 128
  resourcedetection:
    detectors: ["env", "system"]
    override: false
  batch:
  resource/add_environment:
    attributes:
      - key: deployment.environment
        value: prod
        action: upsert

exporters:
  debug:
    verbosity: detailed
  otlphttp/grafana_cloud:
    endpoint: "https://otlp-gateway-prod-eu-central-0.grafana.net/otlp"
    auth:
      authenticator: basicauth/grafana_cloud

service:
  extensions: [basicauth/grafana_cloud]
  pipelines:
    metrics:
      receivers: [otlp, prometheus]
      processors: [resource/add_environment, memory_limiter, resourcedetection, batch]
      exporters: [otlphttp/grafana_cloud]
    traces:
      receivers: [otlp]
      processors: [resource/add_environment, memory_limiter, batch]
      exporters: [otlphttp/grafana_cloud]
    logs/nginx:
      receivers: [filelog/nginx]
      processors: [resource/add_environment, batch]
      exporters: [otlphttp/grafana_cloud]